Design school alumnus Piero Zagami, working in collaboration with Tiziana Alocci, launched the third edition of data visualisation zine Market Cafe Mag earlier this month. The publication includes comment, critique and analysis of the rapidly evolving field of data visualisation and showcases key projects by leading, as well as lesser-known, practitioners.
Described as an experimental, self-initiated and self-funded publication, Zagami and Alocci highlight how Market Cafe Mag was born out of their mutual frustration with a lack of dedicated and in-depth coverage of the emerging design practice of data visualisation. They seized the chance to fill this gap, and the opportunity to celebrate innovative projects and practitioner they admired and were inspired by and now they see supporting and sustaining the growing international community of practice data visualisation as a key ambition for their publication.
Zagami completed the Postgraduate Diploma Design for Visual Communication and then the MA in Graphic Design at London College of Communication before embarking on a freelance career with a specialism in data visualisation and information design.
In light of LCC’s launch of an MA in Data Visualisation, we caught up with Piero and Tiziana to find out more about the magazine and the developing practice of data visualisation…

Can you tell us a little more about Market Cafe Magazine?
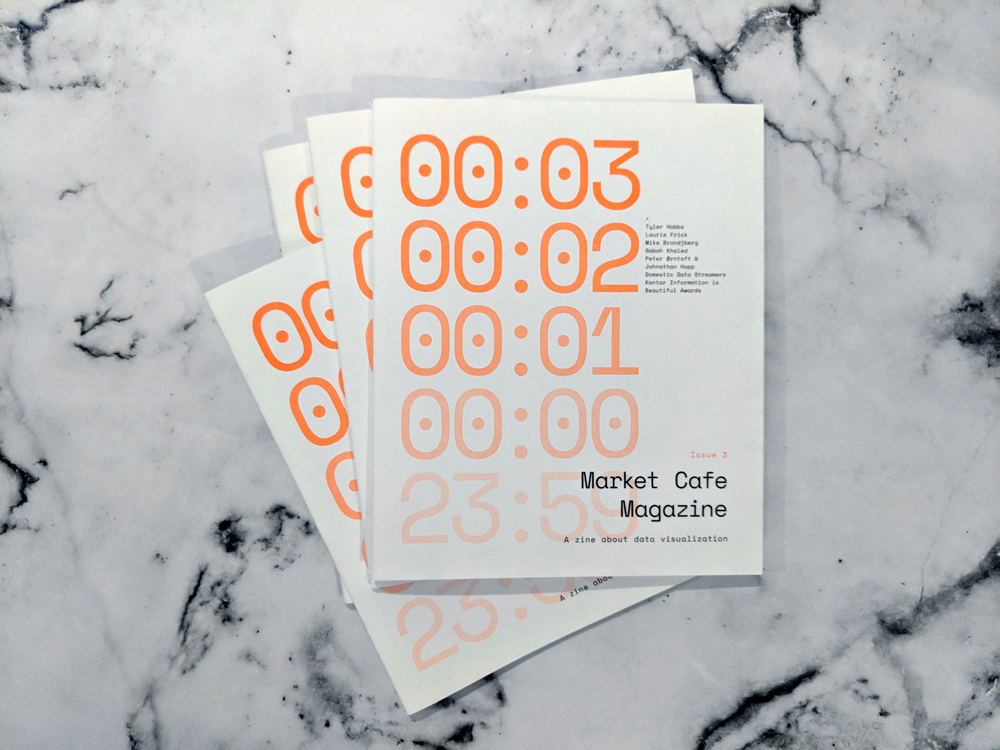
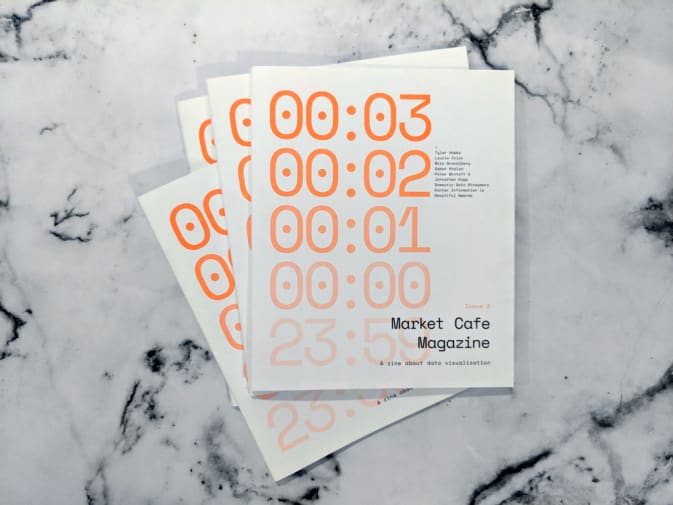
Market Cafe Magazine is a zine about data visualization; you’ll hear from different voices about what designing information means and where it’s going. Our mad research brought us to discover the most talented and finest people in the industry to guide you through this journey. The magazine revolves around a distinctive topic which changes every issue, and looks at how specific data visualization projects tackle the topic at hand. For example, the latest issue (Issue 3) is focused on the subject of visualising time and expressing the concept of temporariness. Within the magazine, our readers will find interviews, small essays and open letters written by our contributors, and indeed, exclusive images of the projects we are so passionate about.
One of the signature features of the zine is a duo-tone colour style, which makes every issue very distinctive and visually striking. This restriction is a challenge because it requires adjusting the work of the contributors to a more limited colour palette. This boundary of translating all these amazing pieces of work, that come in many different colours, into an almost gray-scale image is a challenge. We work carefully with our contributors in the colour-adjusting process to make sure the new colours do not alter the original concept. Our goal is to make it in a way that would still make our contributors happy to share these pieces, and for us to craft a bold and unique publication.

How did Market Cafe Magazine come about?
The idea of the magazine came up in one of our evening catch-ups at the pub when we were talking about dataviz, latest trends, talents and cool projects spotted around. We thought it’d be cool to share this knowledge and get up close and personal with the designers and artists we so much admire. Although it’d be easier to make a blog, we thought it would be much more fun to make something physical that can act as a trace – an archive of all these amazing works.
What do you hope to achieve with Market Cafe Magazine?
The world of data visualisation is growing at a faster pace than ever. Dataviz projects range from the uber-scientific to the wildly artistic in all kinds of human and social sciences. Market Cafe Magazine is an attempt to collect, observe and explore the different streams and voices the make the world of dataviz today. Every issue of the zine is like a magnifying lens on a specific subject which we investigate by exploring dataviz projects and interviewing the practitioners.

How did you find the transition from education into working life?
Piero: The transition from education into working life seemed to go hand-in-hand with a very strange time for design where another transition was taking place; a new standard for digital design was transforming the industry at the end of the first decade of the 2000s. The explosion of digital design, the advent of UX and UI design and the world of data visualisation were like vague concepts to me. There was a gap in what I thought I knew and what the industry demanded of me; today I’m glad to see that the academic world is adapting to accommodate an ever-changing design world with new courses that reflect this transformation such as the new MA Data Visualisation at LCC. The booming of courses in data visualisation is certainly a refreshing sight and I wish that they had been available when I was a student.
What inspires you most?
The work of our contributors is what keeps us inspired. While being data visualisation practitioners ourselves, we spend lots of our time reading and keeping up to date with the latest trends and projects in dataviz. We are always on the hunt for surprising takes on visualising data in ways that are new, thoughtful, crafty and ultimately purposefully engaging.

What is the most valuable lesson from your time at LCC?
Piero: “My masters in Graphic Design at LCC is a cornerstone in my design background – it was there that I learned the valuable lessons of sharing ideas and collaborating with my peers. During the MA I met some of my best friends, not to mention that these are people I have worked with more than once. Today I enjoy collaborative work a lot. By collaborating on shared goals and ideas, I had the opportunity to work on some amazing projects and grow my network for new opportunities. This is also reflected in the work that Tiziana and I do with the zine, as the zine itself wouldn’t be possible without the input of all our contributors.
Tiziana: “I’ve been lucky enough to attend and graduate at the M.Sc. in Communication Design at Politecnico di Milano in 2014. What a unique experience! Working closely with the Density Design team helped me to have a 360 degree view on what understanding complex social phenomenons and visualising data about them means. The intersection with
disciplines such as anthropology and semiotic was really helpful to build a stronger narrative approach in the body of data visualisation works and projects I did during my two-year masters.”
How did your time on the course at LCC prepare you for creating such a project and body of work?
The time spent at LCC taught us that the process is just as important as the outcome, this is why we invest so much time in researching and exploring the dataviz landscape, carefully crafting a narrative that connects different stories that are engaging for our readers.

What are you working on now and what is next for you?
After a successful first year of the magazine, we have high ambitions of the future of Market Cafe Magazine. We just hosted the first dataviz zine exhibition in London and we couldn’t be happier with the feedback we are getting from our readers. We are currently working on the new (fourth!) issue of the magazine as well as a new series of group activities revolving around print-making and visualizing personal data – that should be exciting!
- Find out more about Market Cafe Magazine.
- Find out more about LCC’s new MA Data Visualisation
- Read more about MA Data Visualisation in our interview with the course leader.